Freelance Work Experience at MonitorMe.io
May 10, 2024
Introduction
As this month marks the upcoming launch of the entire product, I’ll soon be bidding farewell to the MonitorMe.io team. With that in mind, I figured, why not document the entire experience and journey, detailing each step of my work as a frontend developer?
So, grab yourself a cup of coffee, settle in, and enjoy the read! 😊
Beginning
In early September 2023, my friend Chinmay told me about a opportunity to work at MonitorMe.io and recommended me as a frontend freelancer to join the project. I’m really thankful to him and Bishakh Gosh — Co-Founder of Pinggy.io as they helped me getting this opportunity.
My journey with the team began on September 15th. On the very first day, the Shuvam and Abhishek walked me through the product’s idea and vision. Understanding this was crucial for me to design UI and experiences that aligned perfectly with their vision. They were incredibly helpful in explaining the product and delving into the nitty-gritty details of the market’s existing competition.
I quickly learned that in the Uptime Monitoring and Synthetic Monitoring market, UI and UX often take a backseat. Recognizing this, we aimed to prioritize improving the user experience for our MVP. So, throughout the first week, I sketched out basic designs for each frontend route, laying the groundwork for the months to come.
MonitorMe is the platform where business can track their mirco-services, monolith web applications, and host their public status pages.
Tech stack and Languages
Our frontend stack is Nextjs and to pace up the process of writing the UI, we choose Mantine UI library — a perfect abstraction of UI components which you need to build B2B or B2C web applications.
While deciding between TypeScript and JavaScript, Abhishek granted me the freedom to make the call, since I would be working on the frontend solo. After thorough research and consideration of the pros and cons of both options, I leaned towards TypeScript for its strong typing system. However, I also weighed the fact that our API endpoints’ responses were not yet fully defined and could change as we progressed with each feature.
Ultimately, I chose JavaScript over TypeScript to avoid type masterbation.
Edited: Reflecting on that decision, I realize there wasn’t a clear winner between TypeScript and JavaScript. The only advantage TypeScript would have provided is a well-documented code base for our response data, which could have been beneficial for new developers joining the project.
Frontend is not only about UI
Long polling data with Redux:
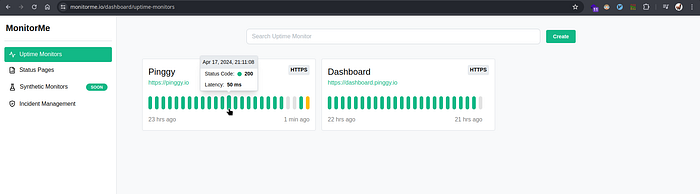
In the dashboard view, we stumbled upon an opportunity to display live data for each monitor created by the user. There are two possible ways for this implementation
1. using sockets
2. long polling
We settled on long polling for its simplicity and because we weren’t certain whether this feature would be a long-term necessity.
At first glance, this feature may seem straightforward — the frontend hits an endpoint to retrieve new data and renders the data again. However, I took it a step further. By predicting the timestamp of the next data point, which we can predict based on monitor’s heartbeat and the last data point received, I optimized our polling strategy. This allowed us to hit the endpoint right after a new data point is being created, enhancing the real-time nature of our data display.
Without delving into socket implementation, I successfully integrated live monitor data, enabling the rendering of each candle, as shown in the image.
Also I made good use of Redux to manage the global state corresponding to this live chart data of each monitor. This setup made frontend development much smoother by keeping the data layer separate from UI components and routes with single source of truth for data.
However, I have to admit, I wasn’t a big fan of the boilerplate code required to set up Redux in React using redux-toolkit. Nevertheless, the benefits it brings, like simplifying state management and ensuring consistency across the app, make it all worth it in the end.
Public Static Status Pages:
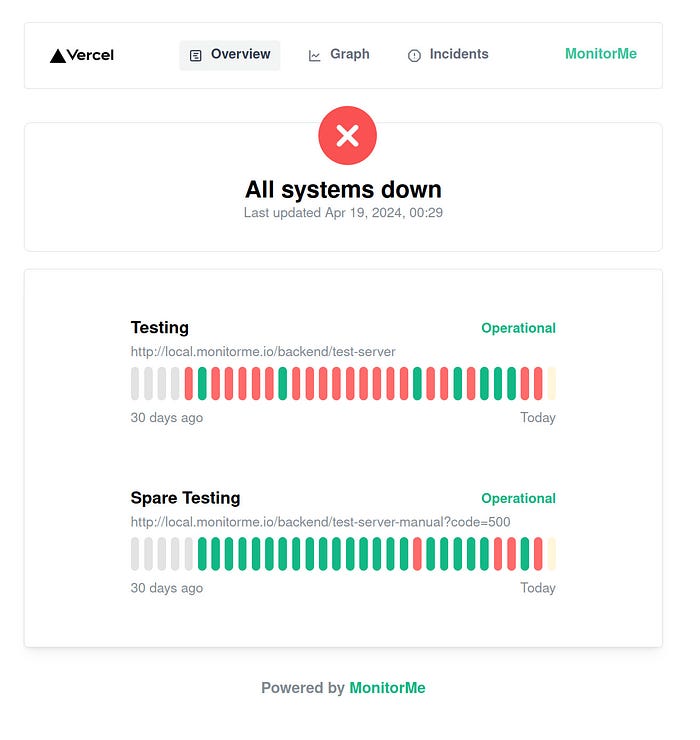
You’ve probably seen those branded status pages of companies, displaying the live status of their services — whether they’re up and running or facing issues, along with a history of past incidents. Since we can’t expose our API endpoint publicly so we can’t use client-side rendered status pages.
I came up with a solution using Next.js’s ISR (Incremental Static Regeneration) feature. It’s pretty cool — it helps us regenerate the page every 15–20 minutes and update the data/prop right on the server itself. This way, our status pages stay fresh without exposing any sensitive endpoints. Plus, as our status pages are static, we don’t need to make round trips to the database to render the page. This would have been the case if we have chosen the client side rendered page with exposing the endpoint publicly accessible.
Live Charts:
As you can see in the GIF above, we’ve incorporated a live chart to display the candles and monitor latency. I opted for ApexChart due to its extensive customization options. Initially, I implemented this feature by referring to the documentation. However, a problem arose: every time a new data point was polled from the backend, the entire graph would rerender (each and every point). This was caused due to I had passed the global state as prop to the LiveChart component, since this state is getting mutate by long-polling mechanism and in action’s fulfilled callback, I had used shift operation on array of this live chart data. Since this operation causes array to remove the first index datapoint but with the cost of reindexing all other elements in the array. Due to this rendering of all points was happening in apex chart.
I solved this issue by managing a new local state within the LiveChart component itself. I updated this state by appending new data points and adjusted the view of the graph using the minand max range in the xaxis option provided by ApexChart. This way, whenever a new data point was polled, it was simply added to our local array, and the view was adjusted to display only the last 48 points.
What I learnt?
- Importance of communication — I always prefer to ask questions rather than be in doubt. It helped me make things clear early instead of overthinking.
- Writing a composable and clean code — I learned that the code, especially for composables and components, should be written in a way that makes it reusable across products.
- Importance of code review: Initially, Abhishek and Shuvam reviewed my frontend changes and provided some valuable feedback. One key point was to avoid using abbreviations in naming variables and functions. Instead of something like
SpCandle, they suggested usingStatusPageCandlefor clarity. This ensures that even new developers can easily understand the code without needing to decipher abbreviations and context
What better could I have done?
- Of course, seeing my code after a while, I always find few improvements that can be made.
- Better communication across backend team
- As this was my first gig, I was not much confident in the negotiation
Conclusion
We built a really great product in the last few months and I’m really proud of the work and frontend code that I wrote for MonitorMe.io
MonitorMe is great project by Shuvam and Abhishek and both are really passionate to solve the monitoring and testing problem. Despite they are building this project alongside with their daily job, I never felt difference in their energy while in the daily sync up meet. Someday, I aspire to be a developer as dedicated and passionate as them! 😊
Thank you 🙏 for reading until now, I hope you enjoyed it.
If you want to connect with me go ahead and hop into my DMs.